01
Demand fit
How well the institution's supply matches what the market is actually hiring for. The largest single contributor.
Placement rate tells you what happened. It does not tell you which department to fix, which syllabus has drifted, or what to put in front of the board next month. SkillDrift gives leadership a measured employability position for the institution, and the department-level detail behind it.
A weighted composite of four measured components, all four tracked. Every figure is computed deterministically in the backend. The AI layer receives anonymised aggregates and writes interpretation. No figure on the page is model-generated, and no student personal data reaches the model.
How well the institution's supply matches what the market is actually hiring for. The largest single contributor.
The cohort's measured Career Readiness, aggregated.
What actually happened at the end of the pipeline.
Employer relationships and their activity.
Department by department and course by course, where teaching is drifting from what employers are hiring for, with the gap sized. It turns a strategic worry into a budget line. Nothing else in the platform speaks to a Dean or a Provost in their own language, and it is the strongest single argument in the leadership conversation.
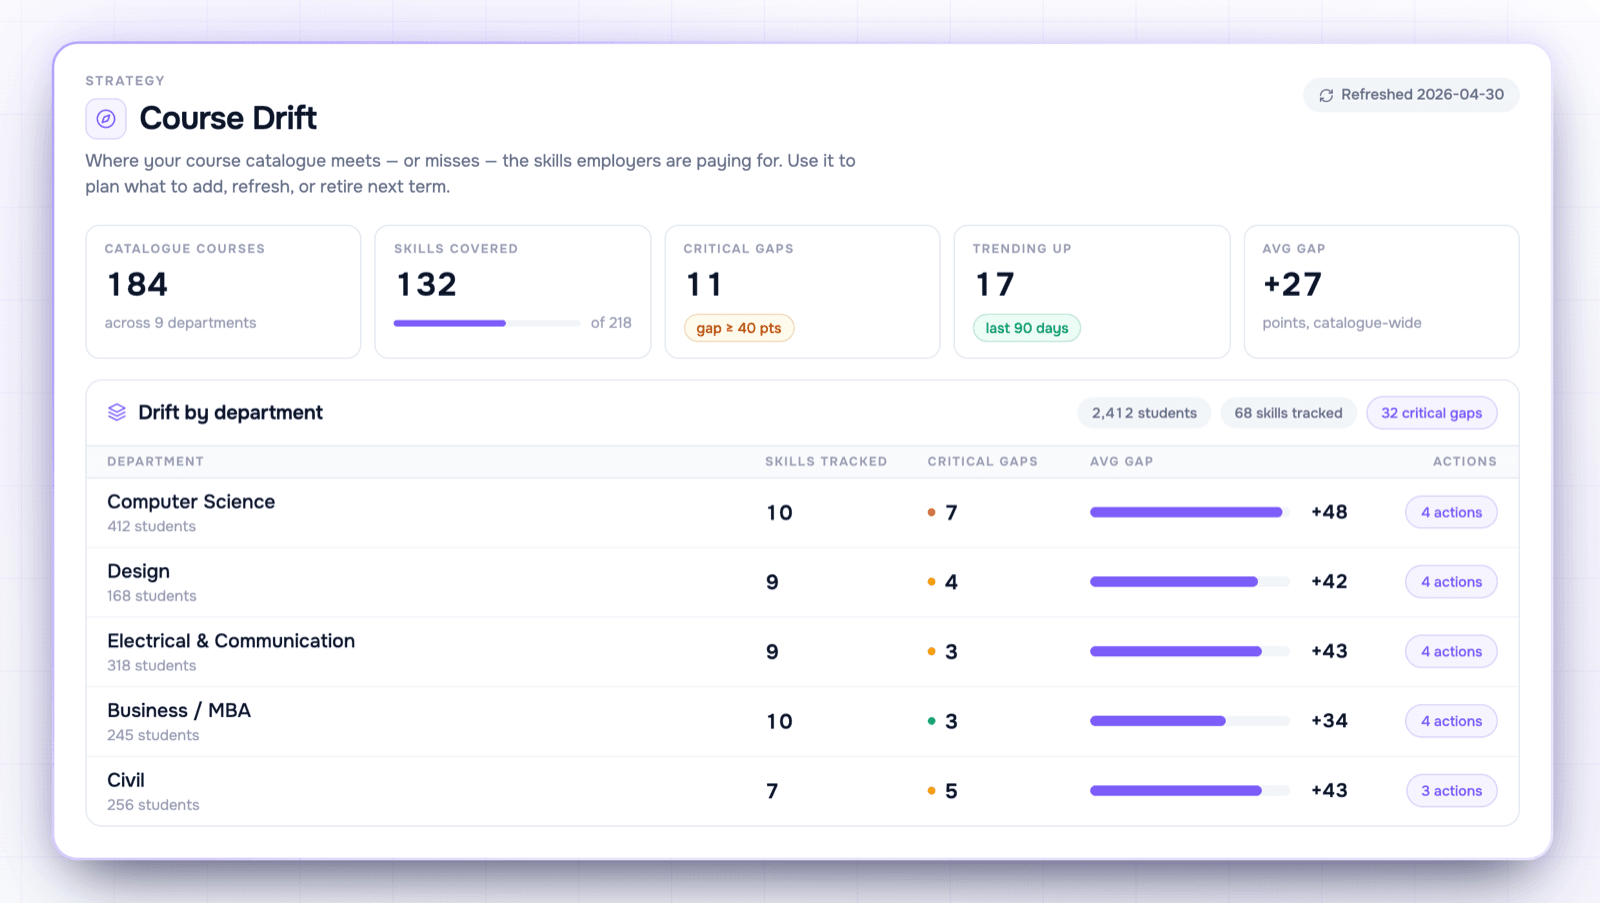
A daily executive snapshot with per-department priorities, the reasoning behind each, and the specific ask. Regenerable on demand.
Department scorecards with readiness distribution, strengths and top gaps, filterable by dimension. Placement analytics per school and per programme. Summary and detailed CSV export.
Institutions typically pay across eleven separate career tool categories that do not talk to each other. One platform, one price per student per year, one set of numbers.